As enterprises move to digitize their business to stay competitive in the market, application needs exponentially increase in diversity, scale, and require an ever evolving set of infrastructure and flexibility. Public cloud providers, such as Microsoft Azure, solve this problem by providing a scalable and flexible infrastructure for enterprise applications. Some enterprise applications are very security sensitive, so maintaining the on-premise Data Center is also required. This leads to a hybrid cloud architecture in which applications span on-premise to public cloud domains.
Since the applications are the key drivers for new revenue streams as opposed to a support function, the network associated with the infrastructure becomes critical. However, monitoring the network in a hybrid cloud architecture to ensure up-time, proper bandwidth allocation, etc., is a tremendous challenge especially when applications do not behave as expected. Transient issues are among the most challenging and costliest. Coupling these issues with the fact that network traffic doesn’t easily correlate between on-premise and public cloud VMs due to various functions in the network layers makes it extremely difficult to get any visibility of the traffic to troubleshoot issues.
The traditional way for customers to get visibility is to collect packet captures and use tools such as Wireshark to try to debug issues. Or they utilize homegrown tools that process packet capture files. If you only need to troubleshoot a single location, then a single packet capture from a given location can be analyzed. However, since applications have become distributed across many different VMs located almost anywhere (office, data center, cloud), it is virtually impossible to pin-point a problem to a specific packet capture from a specific VM at a specific time.
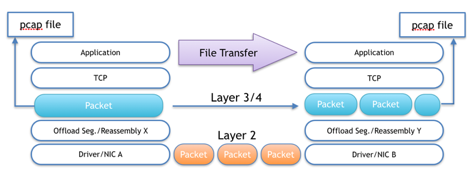
The ideal way to troubleshoot a problem is to synchronize captures across the VMs and sites, then correlate those captures to see the traffic across an entire network for all the applications. Up until now, there have been huge technical challenges to obtaining, synchronizing and correlating packet captures across different locations in the cloud. Without direct access to the host’s network interfaces, packets are reassembled into each VM differently. This means you cannot correlate traffic between VMs using Wireshark as in Figure 1:
Various TCP reassembly offload functions either in the host system or in the VM kernel receive packets that are much larger in size than what can be sent on the wire. These offloads include Generic Receive Offload (GRO), Large Receive Offload (LRO), and possible HW TCP offload engines (TOE). These offloads run independent of the transmit side and therefore result in variations in packet sizes received by packet capture tools like tcpdump. If you are trying to correlate packets, then it is very problematic. The Figure 2 illustrates:
There are 2 major types of tools customers use in this space today. There are application monitoring tools and there are network monitoring tools. Almost all network monitoring tools today provide single point metrics for visibility and then try to do rough correlation of these point metrics across different locations in the network. The problem is that rough correlation of point metrics does not show details of actual transient network conditions. Detrimental flows in a network such as elephant flows or rogue flows cannot be uniquely identified through averaging of point metrics across nodes. Many of these tools also incorporate synthetic traffic generation to estimate the performance. If you do not monitor the actual traffic, then you will miss the transient flows that cause application performance issues.
Furthermore, application monitoring tools just look at how an application is performing in it’s own domain. Shared infrastructure, such as a network, and its impact across all applications cannot be known by only looking at the application end points. Of course, a user will see that applications are experiencing issues, but they will likely not know the location of the issue. Is it the network, the server, the storage…?
Jolata TruFlow solves all of these challenges. TruFlow monitors and correlates application traffic to specific network locations and correlates the performance in and between monitoring points. TruFlow provides real-time and historical network performance by monitoring each and every packet and flow across a hybrid cloud network. This enables transient issues to be seen and ultimately auto-detected in real-time and provides a REST API into the historical database allowing machine intelligent baselining, anomaly detection, and network optimization. TruFlow supports hybrid cloud monitoring as well as on-premise Data Centers and WAN.
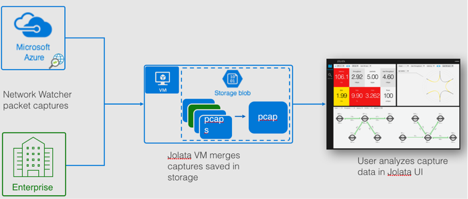
For the public cloud, Microsoft Azure offers Network Watcher. Azure Network Watcher enables a customer to capture packets from a particular VM and store it in a Blob storage for offline analysis. Imagine you have multiple captures across several VMs and you want to see how the traffic is flowing between the VMs. For TCP, you have the problem of the reassembly offload that cannot be turned off and it makes the captures impossible to correlate. Jolata TruFlow works together with Azure Network Watcher to take synchronized captures across all VM’s and on-premise sites. TruFlow correlates, synchronizes, and takes care of all the TCP reassembly offload issues and presents the network and application performance metrics to the customer in an intuitive interactive user interface. Network Watcher provides the customer the capability to synchronize captures across all the VMs for up to 5 hours of continuous monitoring. Together, TruFlow and Network Watcher enable offline analysis of inter-VM network flows. Furthermore, if a user enables capture at their on-premise site for a hybrid cloud deployment, TruFlow can incorporate this additional packet capture and provide full hybrid cloud visibility. Solving this issue brings tremendous value to IT network operators needing to troubleshoot issues with their hybrid cloud applications.
Figure 3 shows how the user would utilize this technology:
If you are interested in trying out Jolata TruFlow in analyzing your netwatcher capture files, please register here at http://signup.jolata.info to show your interest. You can also email us at [email protected].
Here are some key use cases that are normally difficult to debug, but are now easy with Microsoft Azure Network Watcher and Jolata’s TruFlow platform.
Usecase #1: Topology Optimization
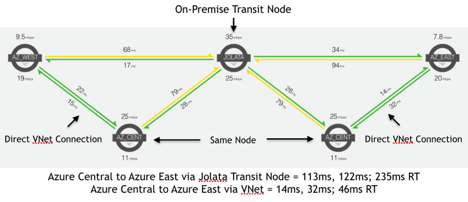
In some hybrid cloud deployments, the application topologies may be set up as a hub-and-spoke model in order to control traffic flows between different applications or users. Essentially, centralizing the security between the applications with an on-premise controlled firewall. While this may ensure complete control over the security, it can create a significant bottleneck for traffic to always transit through the on-premise nodes between different cloud domains. Visualizing and understanding the impact of this topology can easily be seen by utilizing TruFlow in conjunction with Network Watcher. Upon capturing packets utilizing Network Watcher at 4 locations with active traffic and utilizing the spatial map view of TruFlow’s UI, it is easy to see the latency and hence, performance impact of utilizing the Jolata office as a transit node.
As you can see there is excess latency going through the transit node due to WAN bandwidth bottlenecks. One solution could be to increase the WAN bandwidth. The other solution could be to directly connect multiple cloud domains with a VNet. When utilizing VNet, there is a significant decrease in network latency that would result in an increase in application performance.
Usecase #2: Elephant flow control
Often you have applications that can misbehave by consuming too much bandwidth for a given period of time, dubbed an “elephant flow”. These flows are disruptive to the other applications trying to use the network and can cause excess latency to build-up resulting in application performance issues. TruFlow can see these elephant flows in real-time and enabling them to be identified and blocked. Figure below illustrates.
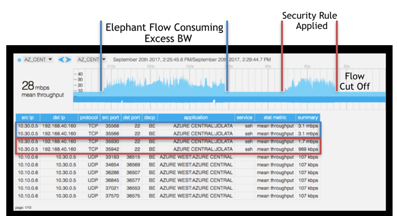
By utilizing Network Security Groups (NSG), a component of Network Watcher, the flows can be configured to be blocked from that particular VM to ensure other applications are not impacted.
Furthermore, Loss, latency, throughput, etc. can viewed for each connection at that point in time enabling visibility into other applications that may be affected. Troubleshooting difficult transient issues can now be done in seconds instead of days to hours.
In summary, enterprises are moving to hybrid cloud architectures with highly distributed applications. The dependency on having a reliable network is ever increasing for revenue streams. Current tools lack in the ability to fully visualize and troubleshoot the network. Jolata TruFlow provides a unique ability to visualize an entire hybrid cloud deployment in real-time or offline. Utilizing Network Watcher in conjunction with TruFlow enables on-demand analysis of historical packet captures for detailed troubleshooting of network issues in an automated way. To show interest in utlizing Jolata with Network Watcher signup here at http://signup.jolata.info.